Grafana Dashboard
Klag ships a comprehensive, pre-built Grafana dashboard. It’s published on
Grafana.com
(dashboard ID 25379) and lives in the repo at
dashboard/demo-dashboard.json.
Import
Section titled “Import”Pick either path:
By dashboard ID (recommended)
- In Grafana, go to Dashboards → New → Import.
- Enter ID 25379, click Load.
- Select your OTLP/Prometheus-compatible data source, click Import.
From the repo
- In Grafana, go to Dashboards → New → Import.
- Upload
dashboard/demo-dashboard.json. - Select your OTLP/Prometheus-compatible data source.
- Adjust the refresh interval and time range as needed.
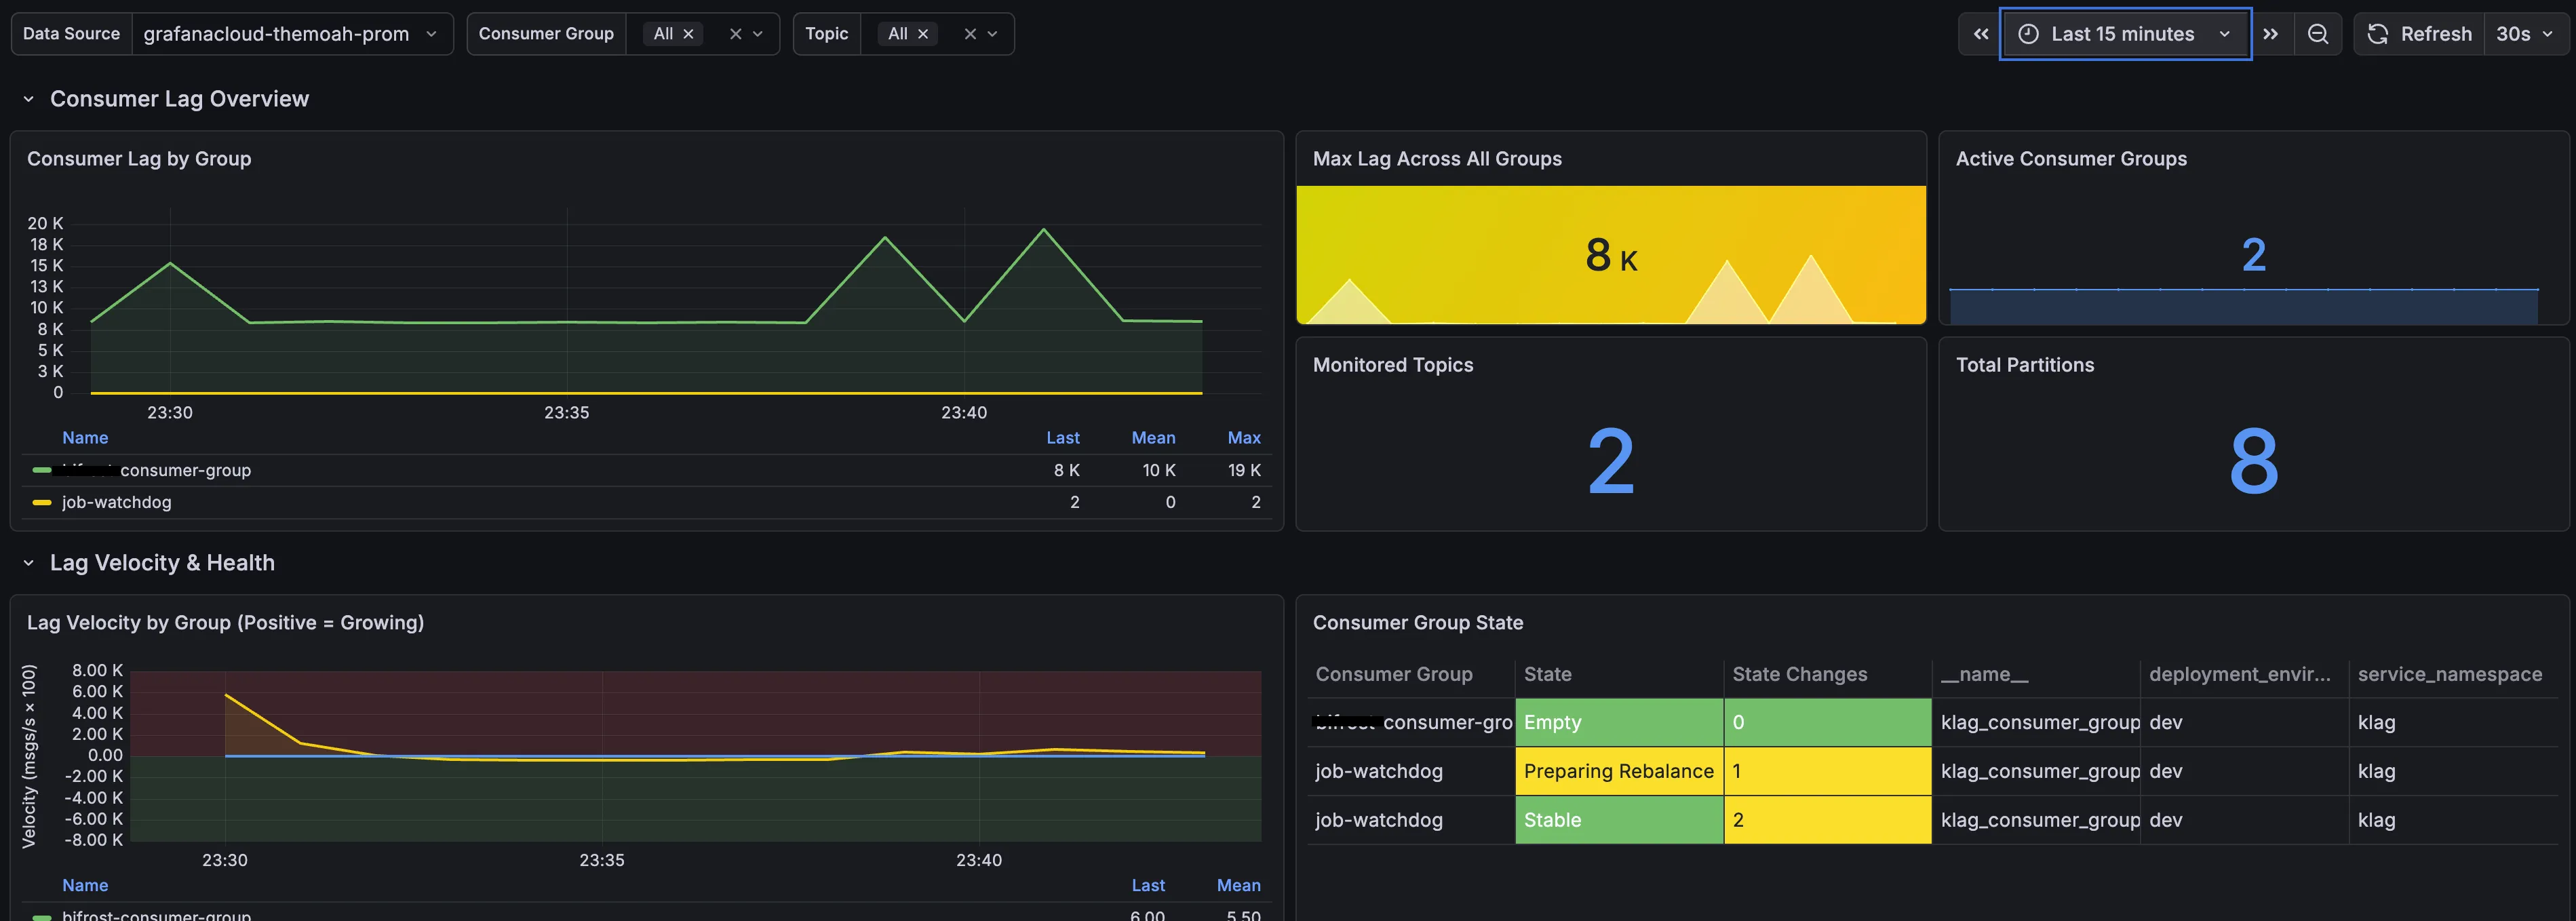
What’s included
Section titled “What’s included”- Consumer Lag Overview: real-time lag by group with color-coded thresholds.
- Lag Velocity Tracking: is lag growing or shrinking over time.
- Consumer Group Health: state table with alerts for unhealthy states.
- Partition & Offset Details: topic throughput and per-partition lag.
- Hot Partition Detection: count, table, and time series.
- Under-Replicated Partitions (ISR): count, table, and time series.
- Time-Based Lag: max time lag, groups catching up, time-to-close charts.
- Commit Staleness: time since Klag last observed each lagging group and topic advance its committed offset.
- Data Loss Prevention: retention-risk and at-risk topics panels.
- JVM panels: memory, GC pause, threads, CPU, allocation rate, loaded classes.
- Template variables: filter by consumer group and topic; auto-refresh every minute.
Requirements
Section titled “Requirements”- Klag running with
METRICS_REPORTER=otlp(orprometheus). - Metrics flowing to Grafana Cloud or a Prometheus-compatible backend.
- A data source configured in Grafana with PromQL support.